Tuesday 17 November 2015

Using KIBANA - from importing Data to sharing data through a Dashboard


 - To be compatible with ElasticSearch, format of the data need to be very specific : it has be a JSON file, with the following rule :
 For each row, you have first to define the id used as index with a following format
 {"index":{"_id":[integer]}}

 This a to be followed by the datarow itself
 {"key1":value1, "Key2":value2,...}

An example is shown on Elastic website at https://www.elastic.co/guide/en/kibana/current/getting-started.html#tutorial-load-dataset
This concerns the file refered as "accounts.json"

Hereby, you will find  some data example taken from the file "accounts.json"

{"index":{"_id":"818"}}
{"account_number":818,"balance":24433,"firstname":"Espinoza","lastname":"Petersen","age":26,"gender":"M","address":"641 Glenwood Road","employer":"Futurity","email":"espinozapetersen@futurity.com","city":"Floriston","state":"MD"}
{"index":{"_id":"820"}}
{"account_number":820,"balance":1011,"firstname":"Shepard","lastname":"Ramsey","age":24,"gender":"F","address":"806 Village Court","employer":"Mantro","email":"shepardramsey@mantro.com","city":"Tibbie","state":"NV"}
{"index":{"_id":"825"}}
{"account_number":825,"balance":49000,"firstname":"Terra","lastname":"Witt","age":21,"gender":"F","address":"590 Conway Street","employer":"Insectus","email":"terrawitt@insectus.com","city":"Forbestown","state":"AR"}
{"index":{"_id":"832"}}
{"account_number":832,"balance":8582,"firstname":"Laura","lastname":"Gibbs","age":39,"gender":"F","address":"511 Osborn Street","employer":"Corepan","email":"lauragibbs@corepan.com","city":"Worcester","state":"KS"}
{"index":{"_id":"837"}}
{"account_number":837,"balance":14485,"firstname":"Amy","lastname":"Villarreal","age":35,"gender":"M","address":"381 Stillwell Place","employer":"Fleetmix","email":"amyvillarreal@fleetmix.com","city":"Sanford","state":"IA"}
{"index":{"_id":"844"}}
{"account_number":844,"balance":26840,"firstname":"Jill","lastname":"David","age":31,"gender":"M","address":"346 Legion Street","employer":"Zytrax","email":"jilldavid@zytrax.com","city":"Saticoy","state":"SC"}
{"index":{"_id":"849"}}
{"account_number":849,"balance":16200,"firstname":"Barry","lastname":"Chapman","age":26,"gender":"M","address":"931 Dekoven Court","employer":"Darwinium","email":"barrychapman@darwinium.com","city":"Whitestone","state":"WY"}
{"index":{"_id":"851"}}
[..]

- Once the format of the json is well defined, we have to create a web-service that returns such a json file.
(the json data can be generated using PHP with the json_encode function :
<?php
$tab0=array("index"=>array("_id"=>122345));
 echo json_encode($tab0)."<br>";
 $tab1=array("id"=>122345,"key1"=>"Value1","key2"=>"value2");
 echo json_encode($tab1)."<br>";
?>
)

- Next is to use the cURL library to donwload the remote json file to a localfile on the ElasticSearch server :
 curl -o local.json url_remote.json

- Next is to insert this json into elasticSearch specifying the index, you can use the fololowing command :

curl -XPOST "localhost:9200/[Indexname]/[TypeName]/_bulk?pretty"
 --data-binary @local.json

- A way to visualize the index patterns within ElasticSearch :
vcurl 'localhost:9200/_cat/indices?v'


-Integrating the index pattern into Kibana :  let's open a browser and navigate to localhost:5601 to get to Kibana's local site. Click the Settings tab, then the Indices tab. Click Add New to define a new index pattern. In the sample of accounts.json discussed previously, the data-set doesn't contain time-series data; therefore, the box "Index contains time-based events" need to be unchecked; otherwise, the json format need to be changed. Then, you will have to specify the index name and click in "Create" button.


- Discovering Your Data

Click the Discover tab to display Kibana’s data discovery functions:

At the start, the data source (_source) is shown completely :


To narrow the display to only the specific fields of interest, highlight each field in the list that displays under the index pattern and click the Add button.

Adding the account_number field changes the display from the full text of five records to a simple list of five account numbers:

Note that you can narrow also the data display by specifying a query with the"search" box at the top of the page; here, on the side, we define a query search as "account_number:<100")


more information can be found at https://www.elastic.co/guide/en/kibana/current/tutorial-define-index.html

When adding other fields like balance, address, employer, city, state, there is what "Discover" should look like :

- Data Visualization: 
Th

e visualization tools available on the Visualize tab enable you to display aspects of your data sets in several different ways.
Click the Visualize tab to see the different types of visualization:
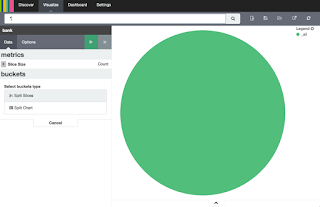
 Click on Pie chart, then From a new search. Select the 'bank' index pattern.

The whole pie displays, since we haven’t specified any buckets yet.
Select Split Slices from the Select buckets type list, then select Range from the Aggregation drop-down selector. Select the balance field from the Field drop-down, then click on Add Range four times to bring the total number of ranges to six. Enter the following ranges:
0             999
1000         2999
3000         6999
7000        14999
15000       30999
31000       50000

Click the green Apply changes button to display the chart:
This shows you what proportion of the 1000 accounts fall in these balance.

Save this chart by clicking the Save Visualization button to the right of the search field. Name the visualization "Pie Chart Balance".

More information on https://www.elastic.co/guide/en/kibana/current/tutorial-visualizing.html.

- Adding Visualizations to the Dashboard:
A Kibana dashboard is a collection of visualizations that can be arranged and shared. To get started, click the Dashboard tab, then the Add Visualization button at the far right of the search box to display the list of saved visualizations.
Let's take the one you just have saved :


You can move the containers for each visualization by clicking and dragging the title bar. Resize the containers by dragging the lower right corner of a visualization’s containe

Click the Save Dashboard button, then name the dashboard Tutorial Dashboard. You can share a saved dashboard by clicking the Share button to display HTML embedding code as well as a direct link.

See https://www.elastic.co/guide/en/kibana/current/tutorial-dashboard.html for more information.


Installing CURL under MS Windows 7 -64 bits

( based on "http://www.oracle.com/webfolder/technetwork/tutorials/obe/cloud/objectstorage/restrict_rw_accs_cntainers_REST_API/files/installing_curl_command_line_tool_on_windows.html")

- In your browser, navigate to the cURL welcome page at http://curl.haxx.se and click Download.
The cURL website offers a wizard to find the appropriate version for your computer's operating system.

For this tutorial, the 64-bit generic, SSL-enabled & SSH enabled version for Windows is selected.
cf  "curl-7.45.0-win64-mingw.7z" at http://curl.haxx.se/dlwiz/?type=bin&os=Win64&flav=-&ver=-&cpu=x86_64

- Uncompress the file to a specific location (by adding  a new directory called "curl")

- Add the corresponding "curl\bin" directory to the environment variable PATH

- Invoke curl.exe from a command window (in Windows, click Start > Run and then enter "cmd" in the Run dialog box), testing it with a website ; A cURL to the Google site should return the corresponding HTML file :

curl www.google.fr

- You can enter curl --help to see a list of cURL commands.

- For example, to save the result from a curl command to localfile, we can use the o option :

curl -o [localfile] [URL]

You will find other practical cURL command examples at http://www.thegeekstuff.com/2012/04/curl-examples/

Thursday 15 October 2015

Installing Kibana, Elasticsearch on MS Windows

http://hadooptutorials.co.in/tutorials/elasticsearch/install-elasticsearch-kibana-logstash-on-windows.html

Install Elasticsearch, Logstash and Kibana

In this series of articles we are going to talk about how to perform log analytics using Elasticseach, Logstash and Kibana. To start with , we will see how to install these softwares on Windows
Install Elasticsearch on Windows
Elasticsearch is a search engine tool/platform which allows us to save the documents to be search in certain format and provides APIs to do full text search capabilities. In the recent times, because of its features like Open Source, Scalability, ease of use, it has become very popular among developer community.
Install Elastic Search is every easy, here are the steps for the same
Donwload latest Elasticsearch zip file from this location. For this demo, we are going to use version 1.4.4. Unzip and extract the content to the suitable directory.
?
E:\>cd es\elasticsearch-1.4.4\bin
E:\es\elasticsearch-1.4.4\bin>elasticsearch
This will start the Elaticsearch service.
Note - The default distribution of Elasticsearch does not give any GUI, you need to install that by executing following command, provided your machine is connectec to internet.
?
E:\>cd es\elasticsearch-1.4.4\bin
E:\es\elasticsearch-1.4.4\bin>plugin -install mobz/elasticsearch-head
Now you can hit http://localhost:9200/_plugin/head/ to see Elastic GUI. which would look like following screen.
More information can be availed at http://mobz.github.io/elasticsearch-head/


 Install Logstash on Windows
Logstash is useful utility when it comes to playing with Logs. It gives you in built-in features to read from various file formats and perform some operations with it. One of the best feature it has is, you can read the logs in certain format (e.g. Apache Logs, NGnix Logs, SysLogs etc.) and put them into Elastic search.
Installing Logstash is very easy, first we need to donwload the required binary from this url. Here we have donwloaded version logstash-1.5.0.rc2
Now unzip the donwloaded binary and save it to some place.
To enable use of Logstash from any directory, add the path to system variable using environment variables.
?
>set LOGSTASH_HOME=E:\logstash\logstash-1.5.0.rc2
>set PATH=%PATH%;E:\logstash\logstash-1.5.0.rc2
And that's it, logstash is ready to use
Install Kibana 4 on Windows
Kibana is a JavaScript library which allows us to create beautiful dashboard reports using elasticsearch data.
Here we are going to use Kibana 4 release as it is compatible with current release of elasticsearch that we are using.
Prior to Kibana 4, we need to have a web server running but with Kibana 4, we get it embeded.
Download Kibana 4 from this url. Just unzip the zip file and save it in some folder.
Kibana configuration is very easy, simply edit config/kibana.yml to add the elasticsearch url and done.
Open config/kibana.yml and update property elasticsearch_url: "http://localhost:9200".
To start Kibana, execute
?
>bin/kibana
A server would get started and you could see the GUI at http://localhost:5601/
If everything goes well, you should be able to see the Kibana dashboard.


Tuesday 24 March 2015

Changing the background color of table rows depending on cell values using JQuery/DataTables/Bootstrap

 Here the final table we would like to generate : different properties appear on that table like changing color row column depending on the value of the colums, applying color on columns values depending of the  inconsistency of the values (for instance) and adding a column with a dropdown menu for different actions:


As clicking on action, we can access different buttons triggering different actions on the row (within a dropdown menu ) 


The change of row color is based on conditions relative to the column values ; this changing will be done with the  "rowCallBack" function(row, data)  on Datatables options - cf. https://datatables.net/reference/option/rowCallback

If you want to specify conditions based on column values, you have to apply conditions based on  row["column value"] :(cf. Column option on Datatables) ; As with Bootstrap, the color of the row can be specify by applying value for the "class" attribute within the <td> tag , here we will be $(row).addClass jQuery function (cf. http://api.jquery.com/addclass/) to alter the coilor of the rows:

Here is the function that we have defined :
        "rowCallback": function( row, data ) {
              if (row["status_fraud"].substring(0,3)=="0" && row["Statut_Cmd"].substring(0,1)!=="0") {
                //$(row).css({"background-color":"#FFDCDC"});
                 $(row).addClass( 'danger' )
            }
              return row;
        },

You can also change the background cell (here below for the fifth column cell) only using this command :
$('td', row).eq(5).addClass('danger');


The dropdown menu action is based on Bootstrap  using various classes such as "btn-group", "dropdown-menu" etc... (cf. http://getbootstrap.com/components/#btn-dropdowns-split), This way we can re-define column value using "render" function ( data, type, row ) on columnDefs  "datatables" option.

"columnDefs":[ 
                {
                "render": function ( data, type, row ) {
                   var BtnReader='<a target="_blank" class="btn btn-success btn-sm"  role="button" href="view.php?id=' + data  + '"> Read' + "</a>" ;      
                    var BtnDelete = '<a  target="_blank" class="btn btn-danger btn-sm"  role="button" href="delete.php?id=' + data + '"> Delete ' + ' </a>';

                    var DropDownAction= '<div class="btn-group">'
                    +
                    '<button class="btn btn-warning btn-sm dropdown-toggle" data-toggle="dropdown" type="button" aria-expanded="false">'
                    +
                    '<i class="fa fa-gear"></i><span class="caret"></span>'
                    +
                    '</button><ul class="dropdown-menu" role="menu">';
                    DropDownAction += '<li>' + BtnReader+ '</li>';
                    DropDownAction += '<li>' + BtnDelete + '</li>';
                    DropDownAction +=' </ul></div>';

                    return DropDownAction;


                },
                "targets": [7]
            }
]

The code for adding action using buttons within table rows has been shown on a previous post as well as the way to show color labels depending on the row properties:

"columnDefs":[ 
              {
                "render": function ( data, type, row ) {
                    if (data === undefined || data === null)  '<span  class="label label-danger">' +  data + '</span>';
                    if (row === undefined || row === null)  '<span  class="label label-danger">' +  data + '</span>';
                    
                    if (row["PSN"].substring(0,3)=="0" && row["Statut_Cmd"].substring(0,1)!=="0")
                      return  '<span  class="label label-danger">' +  data + '</span>';
                    else return '<span  class="label label-success" >' + data + '</span>';
                    
                },
                "targets": [5]
               }
]


These are the HTML and JS files for this post :

HTML FILE:
[..]

  <div class="col-lg-6">
                    <a name="tb" >
                        <div class="panel panel-info">

                            <div class="panel-heading">
                                <h3 class="panel-title"><i class="fa fa-table fa-fw"></i> Paiements en retard</h3>

                                <div class="panel-body">
                                    <table  id="tb" class="table table-bordered table-hover table-striped">

                                        <thead>
                                            <th>PSN </th>
                                            <th>Date commande</th>
                                            <th>Date de dernière modification</th>
                                            <th>Status fraud</th>
                                            <th>Status Bank</th>
                                            <th>Status Cmd</th>
                                            <th>Order Origin ?</th>
                                            <th>Action</th>
                                        </thead>
                                        <tbody>
                                        </tbody>
                                    </table>
                                </div> <!-- /panel-body -->
                            </div> <!-- /panel-heading -->
                        </div> <!-- /panel-info -->        
                    </a>
                </div> <!-- /col-lg-6 -->

[..]


JS FILE :
var table_blocage_fraud_synchro =  $('#tb').dataTable( {
        "language": {
            "url": "http://localhost/boot/js/DataTables.French.json"
        },
        "ajax": {
            "url": "http://localhost/boot/payment.php?function=controle_paiement_retard&param=json",
            "dataSrc": ""
        },
        "columns": [        
            { "data": "PSN" }, //0
            { "data": "date_create" }, //1
            { "data": "date_mod" }, //2
            { "data": "status_fraud" }, //3
            { "data": "status_bank" }, //4
            { "data": "Statut_Cmd" },//5
            { "data": "Order_origin" },//6
           { "data": "PSN" }, //7
        ],
        "rowCallback": function( row, data ) {
            var obj = eval(data);
            //console.log(objdata);
              if ((obj["status_fraud"].substring(0,3)=="0" && obj["Statut_Cmd"].substring(0,1)!=="0")) {
                //$(row).css({"background-color":"#FFDCDC"});
                 $(row).addClass( 'danger' )
            }
              return row;
        },
        "columnDefs":[
              {
                "render": function ( data, type, row ) {
                    if (data === undefined || data === null)  '<span  class="label label-danger">' +  data + '</span>';
                    if (row === undefined || row === null)  '<span  class="label label-danger">' +  data + '</span>';
                    
                    if (row["PSN"].substring(0,3)=="0" && row["Statut_Cmd"].substring(0,1)!=="0")
                      return  '<span  class="label label-danger">' +  data + '</span>';
                    else return '<span  class="label label-success" >' + data + '</span>';
                    
                },
                "targets": [5]
               },
                {
                "render": function ( data, type, row ) {
                   var BtnReader='<a target="_blank" class="btn btn-success btn-sm"  role="button" href="view.php?id=' + data  + '"> Read' + "</a>" ;      
                    var BtnDelete = '<a  target="_blank" class="btn btn-danger btn-sm"  role="button" href="delete.php?id=' + data + '"> Delete ' + ' </a>';

                    var DropDownAction= '<div class="btn-group">'
                    +
                    '<button class="btn btn-warning btn-sm dropdown-toggle" data-toggle="dropdown" type="button" aria-expanded="false">'
                    +
                    '<i class="fa fa-gear"></i><span class="caret"></span>'
                    +
                    '</button><ul class="dropdown-menu" role="menu">';
                    DropDownAction += '<li>' + BtnReader+ '</li>';
                    DropDownAction += '<li>' + BtnDelete + '</li>';
                    DropDownAction +=' </ul></div>';

                    return DropDownAction;


                },
                "targets": [7]
            }
            ]
    } );      
 

Thursday 19 March 2015

"Hello World" in Symfony 2.0

This tutorial is about Symfony 2.and is based on that of  Alexandre Bacco at http://uploads.siteduzero.com/pdf/517569-developpez-votre-site-web-avec-le-framework-symfony2.pdf .

The main difference with Symfony version 1 is about the architecture with the bundles (see http://michelsalib.com/2011/07/10/a-symfony1-4-to-symfony2-migration-why-you-should-learn-symfony2/)

In Symfony 2, at first, you will have to generate a bundle executingin MS DOS prompt (after adding the PHP folder in your PATH environment variable) the following command :

php app/console generate:bundle  (we need to be within your Symfony web root)

A namespace of the bundle is then required : give it the following a name with a"Bundle" suffix -for example : [yoursite]\BlogBundle for a Blog (if you wish to make different website)

For the bundle name, it will provide you a default name in brackets, if you agree, you just have to type ENTER

Idem for the target directory

For the configuration format, I personally prefer the YML format : write "yml" and type ENTER

To the question generate the whole directory structure, say "yes" and type ENTER

And type ENTER for the following question


The bundle is now generated.


Take now your favorite IDE and open your symfony project (personally, I used Sublime Text (see http://www.sublimetext.com/) ; as Symfony is MVC framework, we will define a route then  make a controller with a view :

1 - Go to src/[yoursite]/BlogBundle\ressources\config\routing.yml and add at the end of the file the following code to insert the route of your web site:

[yoursite]_blog_helloWorld:
    path:     /hello-world
    defaults: { _controller: [yoursite]BlogBundle:Blog:index}

Bundle called "BlogBundle", Controller being "Blog" and the action being "index"
2- Add the corresponding controller in a new file called :  src/[yoursite]/BlogBundle\ressources\Controller\BlogController.php with the following code :

<?php
namespace [yoursite]\BlogBundle\Controller;

use Symfony\Bundle\FrameworkBundle\Controller\Controller;
use Symfony\Component\HttpFoundation\Response;

class BlogController extends Controller
{
public function indexAction()
{
// return new Response("Hello World !");
return $this->render('[yoursite]BlogBundle:Blog:index.html.twig');
}
}
?>
3- Add the associated view in a new file  src/[yoursite]/BlogBundle\ressources\views\Blog\index.html.twig

4- In this file add the following content :
<!DOCTYPE html>
<html>
   <head>
   <title>Hello!</title>
    </head>
    <body>
          <h1>Hello World !</h1>
    </body>
</html>

5- Go to the following URL : http://localhost/symfony/web/app_dev.php/hello-world ; then, you should get this kind of screen

Adding a parameter in the controller : that means making some slightly changes to the route, the controller and the view :
  • First thing to change is the route to :

[yoursite]_blog_helloWorld:
    path:     /greeting/{name}
    defaults: { _controller: SdzBlogBundle:Blog:index}
  • The controller needs to be updated  :

[..]
class BlogController extends Controller
{
public function indexAction($name)
{
return $this->render('[yoursite]BlogBundle:Blog:index.html.twig', array('name' => $name));
}
}
  • The view needs also to be updated  :  

<!DOCTYPE html>
<html>
   <head>
   <title>Hello!</title>
    </head> 
    <body>
          <h1>Hello {{name}} !</h1>
    </body>
</html>


The URL call will then be "http://localhost/symfony/web/app_dev.php/greeting/john":


Tuesday 17 March 2015

installing Symfony 2.3 under Windows (XAMPP)

These are the steps for the installation of Symfony 2.3 under Windows: (see http://uploads.siteduzero.com/pdf/517569-developpez-votre-site-web-avec-le-framework-symfony2.pdf)

  1. Add the folder of you "php.exe" in the value of your Path entry within the Windows environment variables ( Open the Start Menu and right click on Computer -  Select Properties - Select Advanced system settings - In the Advanced tab, select Environment Variables. Find the path entry and add at the end : ";C:\[php_folder]\php" )
  2. Launch the command prompt
  3. Go to the web folder used by your local webserver (when using Xampp under MS Windows, that shoud be [xampp_folder]\htdocs)
  4. Install composer using the following command : php -r "readfile('https://getcomposer.org/installer');" | php
  5. Install Symfony with Composer using the following command : php composer.phar create-project symfony/framework-standard-edition [name_web_appli] for example : 
    php composer.phar create-project symfony/framework-standard-edition sf3
  6. Different questions will be asked during the installation (put the default values):
Would you like to install Acme demo bundle ? y/N => y
Database driver : pdo_mysql
Database host : localhost
Database port : null
Database name : symfony
Database user : root
Database password : null
Mailer transport : smtp
Mailer host: localhost
Mailer user: null
Mailer password: null
locale: fr (or 'en') 
Secret: 123456789

  1. Type the following URL : http://localhost/[name_web_appli]/web/app_dev.php
  2. You should have the following screen if your installation is fine : 
To update symfony with new bundles, you should go to composer.json under the symfony directory (sf3 here above) and the bundle in the "require" list :  

    "require": {
        "php": ">=5.5.9",
        "symfony/symfony": "3.0.*",
        "doctrine/orm": "^2.5",
        "doctrine/doctrine-bundle": "^1.6",
        "doctrine/doctrine-cache-bundle": "^1.2",
        "symfony/swiftmailer-bundle": "^2.3",
        "symfony/monolog-bundle": "^2.8",
        "sensio/distribution-bundle": "^5.0",
        "sensio/framework-extra-bundle": "^3.0.2",
        "incenteev/composer-parameter-handler": "^2.0",
        "nelmio/api-doc-bundle":"^2.11"
    },


php ../composer.phar update


add the following code in  sf3/app/config/routing.yml
NelmioApiDocBundle:
    resource: "@NelmioApiDocBundle/Resources/config/routing.yml"
    prefix:   /api/doc

and the following one within "AppKernel.php" :    "new Nelmio\ApiDocBundle\NelmioApiDocBundle()," dans la liste des bundles

Next, all you need is to go that URL, to ensure that everything is working properly:
http://localhost/sf3/web/app_dev.php/api/doc


Under Linux, the installation can be done using the following command (on a Linux server with a LAMP stack) :

composer create-project symfony/framework-standard-edition [name_web_appli]  "3.0.*"

And go to :
http://[server_host]:[port_number]/[name_web_appli]/web/app_dev.php

Notice :  in order to have an access to this URL, you may have to delete some part of the file web/app_dev.php (for example, when using Docker) , especially, from ligne 13 to 19 :

if (isset($_SERVER['HTTP_CLIENT_IP'])
    || isset($_SERVER['HTTP_X_FORWARDED_FOR'])
    || !(in_array(@$_SERVER['REMOTE_ADDR'], ['127.0.0.1', 'fe80::1', '::1']) || php_sapi_name() === 'cli-server')
) {
    header('HTTP/1.0 403 Forbidden');
    exit('You are not allowed to access this file. Check '.basename(__FILE__).' for more information.');
}

Thursday 12 March 2015

Node.js : allowing you to execute JavaScript code in Backend context (outside web browsers)

A very good description of Node.js is shown on that web site : http://www.nodebeginner.org/ (or http://nodejs.developpez.com/tutoriels/javascript/node-js-livre-debutant for the french equivalent).

What is Node.js ?... it's a server-side JavaScript

The first incarnations of JavaScript lived in browsers (on frontend with DHTML first, then, more recently, with frameworks like jQuery). But this is just the context. It defines what you can do with the language, but it doesn't say much about what the language itself can do. JavaScript is a "complete" language: you can use it in many contexts and achieve everything with it you can achieve with any other "complete" language.

Node.js really is just another context: it allows you to run JavaScript code in the backend, outside a browser.

In order to execute the JavaScript you intend to run in the backend, it needs to be interpreted and, well, executed. This is what Node.js does, by making use of Google's V8 VM, the same runtime environment for JavaScript that Google Chrome uses.

Plus, Node.js ships with a lot of useful modules, so you don't have to write everything from scratch, like for example something that outputs a string on the console.

Thus, Node.js is really two things: a runtime environment and a library.

You will find the official installation instruction on that side: https://github.com/joyent/node/wiki/Installation. (I will take here the MS Windows version)


The "hello world" example code using Node.js as a simple web-server

Once, you have downloaded and executed the installation, the first thing that I will suggest is to create a folder ; let's call it "node" ; in that folder, you will put your JavaScript scripts.

let's  create a new file server.js in that folder and paste the following code in that file :

var http = require("http");

http.createServer(function(request, response) {
  response.writeHead(200, {"Content-Type": "text/plain"});
  response.write("Hello World");
  response.end();
}).listen(8080);

If this port is already used, you just have to change it!

All you need now, it's to launch the "Node.js command prompt" and type : 'node node\server.js' and press the Enter key.

Then, go and type on a web browser the following URL : http://localhost:8080/

You should see the following display on the web page : "Hello World"

Creating our Node.js server module

It's common to have a main file called index.js which is used to start our application ;
We will show about how to make server.js a real Node.js module that can be used by our yet-to-be-written index.js main file.
About our server.js, we don't have to change that much. Making some code a module means we need to export those parts of its functionality that we want to provide to scripts that require our module.

For now, the functionality our HTTP server needs to export is simple: scripts requiring our server module simply need to start the server.

To make this possible, we will put our server code into a function named start, and we will export this function:

server.js
var http = require("http");
var url = require("url");

exports.start = function () {
  function onRequest(request, response) {
    var pathname = url.parse(request.url).pathname;
    console.log("Request for " + pathname + " received.");
    console.log("Request received.");
    response.writeHead(200, {"Content-Type": "text/plain"});
    response.write("Hello World");
    response.end();
  }
  http.createServer(onRequest).listen(8080);
  console.log("Server has started.");
};

Notice, here above, that we added a new module module (url) to track the path name of the URL (request); 
This way, we can now create our main file index.js, and start our HTTP there, although the code for the server is still in our server.js file.

Create a file index.js with the following content:

index.js
var server = require("./server");
server.start();

As you can see, we can use our server module just like any internal module: by requiring its file and assigning it to a variable, its exported functions become available to us.
That's it. We can now start our app via our main script, and it still does exactly the same:

node index.js

(Note that our server will probably write "Request received." to STDOUT two times upon opening the page in a browser. That's because most browsers will try to load the favicon by requesting http://localhost:8888/favicon.ico whenever you open http://localhost:8888/).

Accessing MySQL Databases

"Most traditional server-side technologies have a built-in means of connecting to and querying a database. With Node.js, you have to install a library. For this tutorial, I've picked the stable and easy to use node-mysql. The full name of this module is mysql@2.0.0-alpha2 (everything after the @ is the version number). Open your console, navigate to the directory where you've stored your scripts, and execute the following command:  npm install mysql@2.0.0-alpha2

This downloads and installs the module, and it also creates the node_modules folder in the current directory. " (cf. http://code.tutsplus.com/tutorials/nodejs-for-beginners--net-26314)
Now let's look at how we can use this module to export  json  results from a sql query ;  here, is an example :
var mysql      = require('mysql');
var psn_id = 376257924;

var connection = mysql.createConnection({
  host     : 'host_name',
  user     : 'user_name',
  password : 'password',
  database : 'db_name',
});
var queryString = "SELECT * FROM your_table WHERE id = ? " ;
var http      = require('http');
var rep = "";
connection.query(queryString, psn_id, function (error, rows, fields) { 
// Rows variable holds the result of the query. 
rep = JSON.stringify(rows); 
}); 
// Create the http server. 
http.createServer(function (request, response) { 
  response.writeHead(200, {"Content-Type": "text/plain"});
  response.write(rep);
  response.end();
// Listen on the 8080 port. 

}).listen(8080);

Monday 2 March 2015

Dealing with events with Google Charts / Tables

Here are the web references I have used for this articles

  • https://developers.google.com/chart/interactive/docs/gallery
  • https://developers.google.com/chart/interactive/docs/events
  • https://developers.google.com/chart/interactive/docs/basic_interactivity
  • https://google-developers.appspot.com/chart/interactive/docs/gallery/table


Let's take the previous example, with pie chart (adding  'pieHole': 0.5 option to get a like-donut pie chart) ; if you would like to add a listener to catch the click event, you will have to add the following code in 'orange' :

<html>
    <head>
 <script type="text/javascript" src="http://ajax.googleapis.com/ajax/libs/jquery/1.10.2/jquery.min.js"></script>
        <script type="text/javascript" src="http://www.google.com/jsapi"></script>

        <script type='text/javascript'>

            //https://google-developers.appspot.com/chart/interactive/docs/quick_start
            //https://google-developers.appspot.com/chart/interactive/docs/gallery/table
            //https://developers.google.com/chart/interactive/docs/gallery
         
            function drawChart() {
                var json = $.ajax({
                    url: "http://localhost/angularjs/get_repartition_order_status_todaygoogle_pie.php?type=graph",
                    dataType:"json",
                    async: false
                }).responseText;
                jsondata = eval(json);
                // Create the data table.
                var data = new google.visualization.DataTable();
                data.addColumn('string', 'Topping');
                data.addColumn('number', 'Slices');
                data.addRows(jsondata);

                // Set chart options
                var options = {'title':'Order Status for today ',
                    'width':500, 'pieHole': 0.5,
                    'height':400};
                //var options = {'title':'Order Status for today ','width':600, 'pieHole': 0.5,'height':600, 'is3D': true};
                // Instantiate and draw our chart, passing in some options.
                var chart = new google.visualization.PieChart(document.getElementById('chart_div'));
                chart.draw(data, options);
           
                google.visualization.events.addListener(chart, 'select', selectHandler);

                // Notice that e is not used or needed.
                function selectHandler(e) {
                    var selectedItem = chart.getSelection()[0];
                    if (selectedItem) {
                        var value = data.getValue(selectedItem.row, 0);
                        alert('The user selected ' + value);
                    };
                }
            }
     
            // Set a callback to run when the Google Visualization API is loaded.
            google.setOnLoadCallback(drawChart);
            // Load the Visualization API and the piechart package.
            google.load('visualization', '1.0', {'packages':['corechart']});
        </script>
    </head>

    <body>
        <!--Div that will hold the pie chart-->
        <div id="chart_div"></div>
        <div id="table_div"></div>
    </body>
</html>


Now, I would like to trigger a draw of an associated table according to the selected value:

<html>
    <head>
        <!--Load the AJAX API-->
        <script type="text/javascript" src="http://ajax.googleapis.com/ajax/libs/jquery/1.10.2/jquery.min.js"></script>
        <script type="text/javascript" src="http://www.google.com/jsapi"></script>

        <script type='text/javascript'>
         
            function drawChart() {
                var json = $.ajax({
                    url: "http://localhost/angularjs/get_repartition_order_status_todaygoogle_pie.php?type=graph",
                    dataType:"json",
                    async: false
                }).responseText;
                jsondata = eval(json);
                // Create the data table.
                var data = new google.visualization.DataTable();
                data.addColumn('string', 'Topping');
                data.addColumn('number', 'Slices');
                data.addRows(jsondata);

                // Set chart options
                var options = {'title':'Order Status for today ',
                    'width':500, 'pieHole': 0.5,
                    'height':400,'margin' : 0};
                //var options = {'title':'Order Status for today ','width':600, 'pieHole': 0.5,'height':600, 'is3D': true};
                // Instantiate and draw our chart, passing in some options.
                var chart = new google.visualization.PieChart(document.getElementById('chart_div'));
                chart.draw(data, options);
                // orgChart is my global orgchart chart variable.
                google.visualization.events.addListener(chart, 'select', selectHandler);

                // Notice that e is not used or needed.
                function selectHandler(e) {
                    var selectedItem = chart.getSelection()[0];
                    if (selectedItem) {
                        var value = data.getValue(selectedItem.row, 0);
                        // alert('The user selected ' + value);
                        google.setOnLoadCallback(drawTable(value));
                    };
                }
            }
            function drawTable(etat) {
                var json = $.ajax({
                    url: "http://localhost/angularjs/get_repartition_order_status_todaygoogle_pie.php?type=table&status=" + etat,
                    dataType:"json",
                    async: false
                }).responseText;
                JSONObject = eval(json);  
                var new_json = "[";
                for (var key in JSONObject) {
                    if (JSONObject.hasOwnProperty(key)) {
                        new_json += "['" + JSONObject[key]["order_id"] + "'";
                        new_json += ",'" + JSONObject[key]["store_id"] + "'";
                        new_json += ",'" + JSONObject[key]["purchase_serial_number"] + "'";
                        new_json += ",'" + JSONObject[key]["purchase_creation_date"]  + "'";
                        new_json += ",'" + JSONObject[key]["lastmod"]  + "'";
                        new_json += ",'" + JSONObject[key]["status"]  + "'],";
                    }
                }
                //console.log(new_json.length);
                new_json=new_json.substring(0,new_json.length - 1)
                new_json += "]";
                //console.log(eval(new_json));
                var options = {'showRowNumber': true};
                
                var data = new google.visualization.DataTable();
                data.addColumn('string', 'order_id');
                data.addColumn('string', 'store_id');
                data.addColumn('string', 'PSN');
                data.addColumn('string', 'Creation Date');
                data.addColumn('string', 'Modif. Date');
                data.addColumn('string', 'Status');

                data.addRows(eval(new_json));

                var table = new google.visualization.Table(document.getElementById('table_div'));
                
                table.draw(data, options);
            }
            // Set a callback to run when the Google Visualization API is loaded.
            google.setOnLoadCallback(drawChart);
            // Load the Visualization API and the piechart package.
            google.load('visualization', '1.0', {'packages':['corechart','table']});
        </script>
    </head>

    <body>
        <!--Div that will hold the pie chart-->
        <div id="chart_div"></div>
        <div id="table_div"></div>
    </body>
</html>


The result is the following one :


Display Live data with Google Charts, Ajax (through JSON file), and AngularJS

The Google-developers website is the good place to start in order to know how to use of Google-charts within a HTML page :
see https://google-developers.appspot.com/chart/
The on-line JavaScript library that you will need for Google chart is http://www.google.com/jsapi

If you want to use ajax, the best way is to use jquery (the on-line JavaScript library is http://ajax.googleapis.com/ajax/libs/jquery/1.10.2/jquery.min.js)


To draw a pie chart (cf. https://google-developers.appspot.com/chart/interactive/docs/quick_start), here is an example of HTML/JS file :
       
<html>
    <head>
        <!--Load the AJAX API-->
        <script type="text/javascript" src="http://ajax.googleapis.com/ajax/libs/jquery/1.10.2/jquery.min.js"></script>
        <script type="text/javascript" src="http://www.google.com/jsapi"></script>

    <script type='text/javascript'>

            function drawChart() {
                var json = $.ajax({
                    url: "http://localhost/angularjs/get_repartition_order_status_todaygoogle_pie.php?type=graph",
                    dataType:"json",
                    async: false
                }).responseText;
                jsondata = eval(json);
                // Create the data table.
                var data = new google.visualization.DataTable();
                data.addColumn('string', 'Topping');
                data.addColumn('number', 'Slices');
                data.addRows(jsondata);

                // Set chart options
                var options = {'title':'Order Status for today ',
                    'width':400,
                    'height':300};

                // Instantiate and draw our chart, passing in some options.
                var chart = new google.visualization.PieChart(document.getElementById('chart_div'));
                chart.draw(data, options);
            }

            // Set a callback to run when the Google Visualization API is loaded.
            google.setOnLoadCallback(drawChart);
            // Load the Visualization API and the piechart package.
            google.load('visualization', '1.0', {'packages':['corechart']});

            // Callback that creates and populates a data table,
            // instantiates the pie chart, passes in the data and
            // draws it.
        </script>
    </head>

    <body>
        <!--Div that will hold the pie chart-->
        <div id="chart_div"></div>
    </body>
</html>

You may have noticed that I had to convert the JSON output in order to pass the data through addRows method using eval();

The format of the json data is  ([ ["label",value]....] ):
[
   ["new",2955],["processing",721],["shipped",162],[],["cancelled",109],["restocking",11]

]

Now, if you would like to introduce a Google Chart when using AngularJS,

<!DOCTYPE html>
<html>
    <script type="text/javascript" src="http://code.angularjs.org/1.1.0/angular.min.js"></script>
    <script type="text/javascript" src="//ajax.googleapis.com/ajax/libs/jquery/1.10.2/jquery.min.js"></script>

    <script type="text/javascript" src="http://www.google.com/jsapi"></script>
    <script type='text/javascript'>
        //http://snippetrepo.com/snippets/google-charts-with-angularjs
        var app = angular.module('myApp', []);
        app.directive('chart', function() {
            return {
                restrict: 'A',
                link: function($scope, $elm, $attr) {
                    var json = $.ajax({
                        url: "http://localhost/angularjs/get_repartition_order_status_todaygoogle_pie.php?type=graph",
                        dataType:"json",
                        async: false
                    }).responseText;
                    jsonData = eval(json);
                    // Create the data table.
                    var data = new google.visualization.DataTable();
                    data.addColumn('string', 'Topping');
                    data.addColumn('number', 'Slices');
                   
                    data.addRows(jsonData);
                    // Set chart options
                    var options = {'title':'Order Status for today ',
                        'width':400,
                        'height':300};

                    // Instantiate and draw our chart, passing in some options.
                    var chart = new google.visualization.PieChart($elm[0]);
                    chart.draw(data, options);
                }
            }
        });

        google.setOnLoadCallback(function() {
            angular.bootstrap(document.body, ['myApp']);
        });
        google.load('visualization', '1', {packages: ['corechart']});

    </script>
    <body> 
        <!--Div that will hold the pie chart-->
            <div chart></div>

    </body>

</html>

I've shown in "aqua" the few lines that need to be changed when integrating the pie chart within AngularJS: in both cases, the output will look like the above graph.

You can also add 3D effects changing the options value, doing so:
 
var options = {'title':'Order Status for today ',
                        'width':400,
                        'height':300,'is3D': true};


Nota : You can also change the location of the legend (by adding : 'legend':'left')


Another way is presented at http://www.frangular.com/2013/01/google-chart-tools-avec-angularjs.html (that seems more complex at least right now!!) :

Here below, you will fact respectively, the HTML, and JS files giving the same output than above (with 3D option graph):

<!DOCTYPE html>
<html ng-app="angularjs-starter">

    <head lang="en">
        <meta charset="utf-8">
        <title>GoogleCharts in AngularJS</title>

    </head>

    <body ng-controller="MainCtrl">        

        <div style="float: left; width: 600px" ng:model="data"  qn:columns="[{type:'string', name: 'Topping'}, {type:'number', name: 'Slices'}]" qn:piechart="{legend : {alignment: 'center'}, chartArea: {height: 400},backgroundColor: '#F7F7F7'}"></div>
           
        <script src="http://ajax.googleapis.com/ajax/libs/angularjs/1.2.26/angular.min.js"></script>    
        <script type="text/javascript" src="//ajax.googleapis.com/ajax/libs/jquery/1.10.2/jquery.min.js"></script>
        <script src="pieGCharts.js"></script>
        <script type="text/javascript" src="https://www.google.com/jsapi"> </script>
        <script type="text/javascript">
            google.load('visualization', '1.0', { 'packages': ['corechart'] });
        </script>
    </body>

</html>


with pieGCharts.js :
var app = angular.module('angularjs-starter', [
    'charts.pie'
]); 

app.controller('MainCtrl', function($scope) {
    var json = $.ajax({
        url: "http://localhost/angularjs/get_repartition_order_status_todaygoogle_pie.php?type=graph",
        dataType:"json",
        async: false
    }).responseText;
    $scope.data = eval(json);
});

angular.module('charts.pie', [
])
.directive('qnPiechart', [
    function() {
        return {
            require: '?ngModel',
            link: function(scope, element, attr, controller) {
                var settings = {
                    is3D: true
                };

                var getOptions = function() {
                    return angular.extend({ }, settings, scope.$eval(attr.qnPiechart));
                };

                // creates instance of datatable and adds columns from settings
                var getDataTable = function() {
                    var columns = scope.$eval(attr.qnColumns);
                    var data = new google.visualization.DataTable();
                    angular.forEach(columns, function(column) {
                        data.addColumn(column.type, column.name);
                    });
                    return data;
                };

                var init = function() {
                    var options = getOptions();
                    if (controller) {

                        var drawChart = function() {
                            var data = getDataTable();
                            // set model
                            data.addRows(controller.$viewValue);

                            // Instantiate and draw our chart, passing in some options.
                            var pie = new google.visualization.PieChart(element[0]);
                            pie.draw(data, options);
                        };

                        controller.$render = function() {
                            drawChart();
                        };
                    }

                    if (controller) {
                        // Force a render to override
                        controller.$render();
                    }
                };

                // Watch for changes to the directives options
                scope.$watch(getOptions, init, true);
                scope.$watch(getDataTable, init, true);
            }
        };
    }

]);