- To be compatible with ElasticSearch, format of the data need to be very specific : it has be a JSON file, with the following rule :
For each row, you have first to define the id used as index with a following format
{"index":{"_id":[integer]}}
This a to be followed by the datarow itself
{"key1":value1, "Key2":value2,...}
An example is shown on Elastic website at https://www.elastic.co/guide/en/kibana/current/getting-started.html#tutorial-load-dataset
This concerns the file refered as "accounts.json"
Hereby, you will find some data example taken from the file "accounts.json"
{"index":{"_id":"818"}}
{"account_number":818,"balance":24433,"firstname":"Espinoza","lastname":"Petersen","age":26,"gender":"M","address":"641 Glenwood Road","employer":"Futurity","email":"espinozapetersen@futurity.com","city":"Floriston","state":"MD"}
{"index":{"_id":"820"}}
{"account_number":820,"balance":1011,"firstname":"Shepard","lastname":"Ramsey","age":24,"gender":"F","address":"806 Village Court","employer":"Mantro","email":"shepardramsey@mantro.com","city":"Tibbie","state":"NV"}
{"index":{"_id":"825"}}
{"account_number":825,"balance":49000,"firstname":"Terra","lastname":"Witt","age":21,"gender":"F","address":"590 Conway Street","employer":"Insectus","email":"terrawitt@insectus.com","city":"Forbestown","state":"AR"}
{"index":{"_id":"832"}}
{"account_number":832,"balance":8582,"firstname":"Laura","lastname":"Gibbs","age":39,"gender":"F","address":"511 Osborn Street","employer":"Corepan","email":"lauragibbs@corepan.com","city":"Worcester","state":"KS"}
{"index":{"_id":"837"}}
{"account_number":837,"balance":14485,"firstname":"Amy","lastname":"Villarreal","age":35,"gender":"M","address":"381 Stillwell Place","employer":"Fleetmix","email":"amyvillarreal@fleetmix.com","city":"Sanford","state":"IA"}
{"index":{"_id":"844"}}
{"account_number":844,"balance":26840,"firstname":"Jill","lastname":"David","age":31,"gender":"M","address":"346 Legion Street","employer":"Zytrax","email":"jilldavid@zytrax.com","city":"Saticoy","state":"SC"}
{"index":{"_id":"849"}}
{"account_number":849,"balance":16200,"firstname":"Barry","lastname":"Chapman","age":26,"gender":"M","address":"931 Dekoven Court","employer":"Darwinium","email":"barrychapman@darwinium.com","city":"Whitestone","state":"WY"}
{"index":{"_id":"851"}}
[..]
- Once the format of the json is well defined, we have to create a web-service that returns such a json file.
(the json data can be generated using PHP with the json_encode function :
<?php
$tab0=array("index"=>array("_id"=>122345));
echo json_encode($tab0)."<br>";
$tab1=array("id"=>122345,"key1"=>"Value1","key2"=>"value2");
echo json_encode($tab1)."<br>";
?>
)
- Next is to use the cURL library to donwload the remote json file to a localfile on the ElasticSearch server :
curl -o local.json url_remote.json
- Next is to insert this json into elasticSearch specifying the index, you can use the fololowing command :
curl -XPOST "localhost:9200/[Indexname]/[TypeName]/_bulk?pretty"
--data-binary @local.json
- A way to visualize the index patterns within ElasticSearch :
vcurl 'localhost:9200/_cat/indices?v'

 -Integrating the index pattern into Kibana : let's open a browser and navigate to localhost:5601 to get to Kibana's local site. Click the Settings tab, then the Indices tab. Click Add New to define a new index pattern. In the sample of accounts.json discussed previously, the data-set doesn't contain time-series data; therefore, the box "Index contains time-based events" need to be unchecked; otherwise, the json format need to be changed. Then, you will have to specify the index name and click in "Create" button.
- Discovering Your Data
Click the Discover tab to display Kibana’s data discovery functions:
At the start, the data source (_source) is shown completely :

To narrow the display to only the specific fields of interest, highlight each field in the list that displays under the index pattern and click the Add button.
Adding the account_number field changes the display from the full text of five records to a simple list of five account numbers:
When adding other fields like balance, address, employer, city, state, there is what "Discover" should look like :
- Data Visualization:
Th
e visualization tools available on the Visualize tab enable you to display aspects of your data sets in several different ways.
Click the Visualize tab to see the different types of visualization:
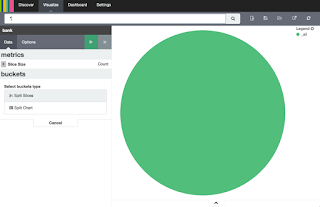
 The whole pie displays, since we haven’t specified any buckets yet.
Select Split Slices from the Select buckets type list, then select Range from the Aggregation drop-down selector. Select the balance field from the Field drop-down, then click on Add Range four times to bring the total number of ranges to six. Enter the following ranges:
0 999
1000 2999
3000 6999
7000 14999
15000 30999
31000 50000
Click the green Apply changes button to display the chart:
This shows you what proportion of the 1000 accounts fall in these balance.
Save this chart by clicking the Save Visualization button to the right of the search field. Name the visualization "Pie Chart Balance".
Save this chart by clicking the Save Visualization button to the right of the search field. Name the visualization "Pie Chart Balance".
More information on https://www.elastic.co/guide/en/kibana/current/tutorial-visualizing.html.
A Kibana dashboard is a collection of visualizations that can be arranged and shared. To get started, click the Dashboard tab, then the Add Visualization button at the far right of the search box to display the list of saved visualizations.
Let's take the one you just have saved :
You can move the containers for each visualization by clicking and dragging the title bar. Resize the containers by dragging the lower right corner of a visualization’s containe
Click the Save Dashboard button, then name the dashboard Tutorial Dashboard. You can share a saved dashboard by clicking the Share button to display HTML embedding code as well as a direct link.
See https://www.elastic.co/guide/en/kibana/current/tutorial-dashboard.html for more information.


